SUPPLY CURVE
SUPPLY CURVE
DEFINITION of 'Supply Curve'
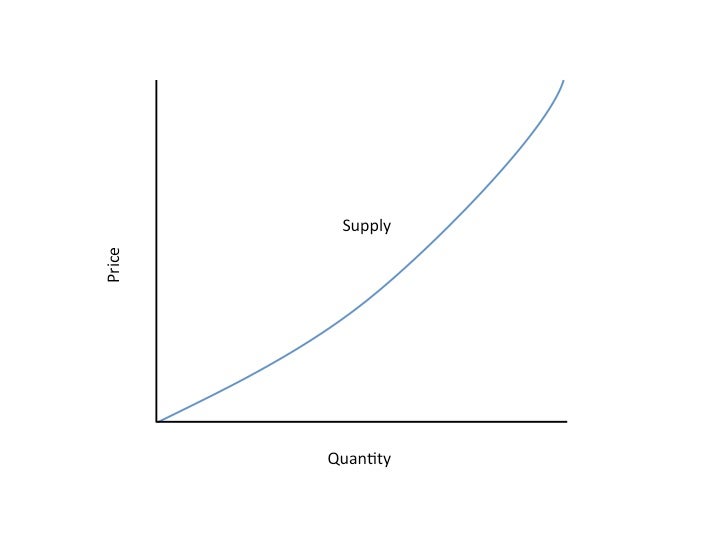
The supply curve is a graphical representation of the relationship between the price of a good or service and the quantity supplied for a given period of time. In a typical representation, the price will appear on the left vertical axis, the quantity supplied on the horizontal axis.
BREAKING DOWN 'Supply Curve'
The supply curve will move upward from the left to the right, which expresses the law of supply: as the price of a given commodity increases, the quantity supplied increases, all else being equal.
Note that this formulation implies that price is the independent variable, and quantity the dependent variable. In most disciplines, the independent variable appears on the horizontal or x-axis, but economics is an exception to this rule.
For example, if the price of soybeans rises, farmers will have an incentive to plant less corn and more soybeans, and the total quantity of soybeans on the market will increase.
The degree to which rising price translates into rising quantity is called supply elasticity or price elasticity of supply. If a 50% rise in soybean prices causes the quantity of soybeans produced to rise by 50%, the supply elasticity of soybeans is 1. If a 50% rise in soybean prices only increases the quantity supplied by 10%, the supply elasticity is 0.2. The supply curve is shallower (closer to horizontal) for products with more elastic supply, and steeper (closer to vertical) for products with less elastic supply.
If a factor besides price or quantity changes, a new supply curve needs to be drawn. For example, say that a number of new soybean farmers enter the market, clearing forests and increasing the amount of land devoted to soybean cultivation. In this scenario, more soybeans will be produced even if the price remains the same, meaning that the curve itself shifts to the right (S2) in the graph below. In other words, supply will increase.
Other factors can shift the supply curve as well, such as a change in the price of production. If a drought causes water prices to spike, the curve will shift to the left (S3). If the price of a substitute – from the supplier's perspective – such as corn increases, farmers will shift to growing that instead, and the supply of soybeans will decrease (S3). If a new technology, such as a pest-resistant seed, increases yields, the supply curve will shift right (S2). If the future price of soybeans is higher than the current price, the supply will temporarily shift to the left (S2), since producers have an incentive to wait to sell.

The terminology surrounding supply can be confusing. "Quantity" or "quantity supplied" refers to the amount of the good or service, such as tons of soybeans, bushels of tomatoes, available hotel rooms or hours of labor. In everyday usage, this might be called the "supply," but in economic theory, "supply" refers to the curve shown above, denoting the relationship between quantity supplied and price per unit.

Comments
Post a Comment